Every tool. In one place.
Riskeys connects to your MetaTrader account automatically. Every trade syncs in real-time, no manual input, no CSV exports.
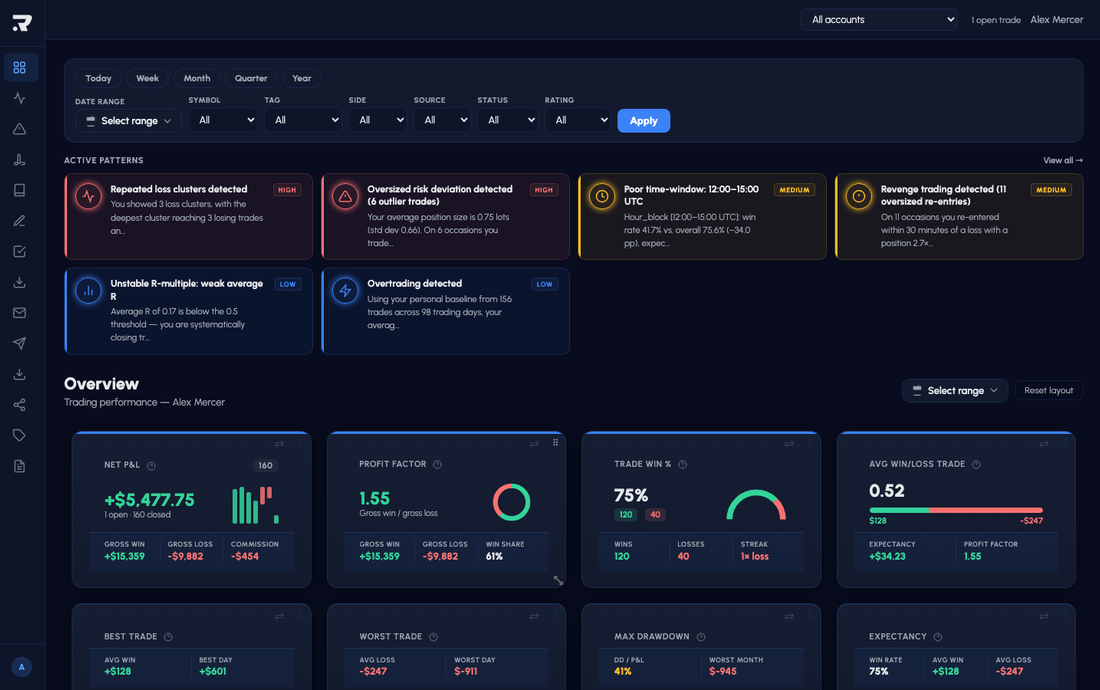
Every KPI that actually matters.
The overview panel shows your full performance picture at a glance: profit factor, win rate, Sharpe Ratio, Z-Score, AHPR, GHPR, best and worst trade, longs vs shorts breakdown, balance, equity, and commission tracking. Filter by All time, This month, or This week.
- trending_upProfit Factor, Expectancy, Win Rate
- analyticsSharpe Ratio, Z-Score, AHPR, GHPR
- compare_arrowsBest / Worst trade + Longs vs Shorts
- account_balance_walletBalance, Equity, Commission tracker
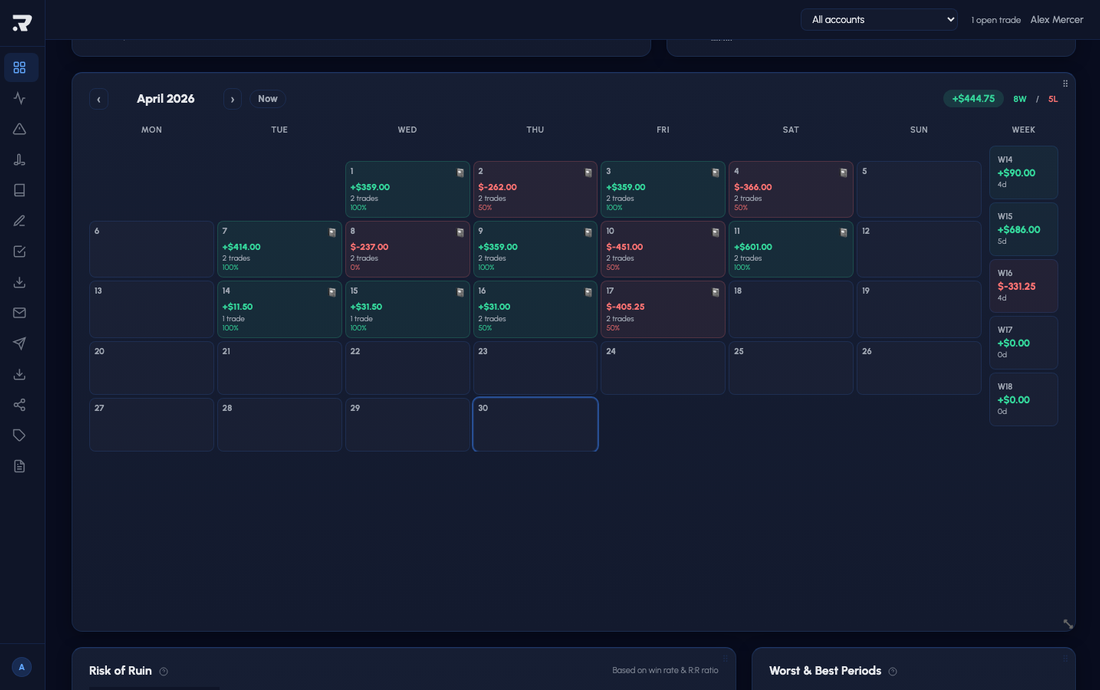
See every trading day. At a glance.
The calendar view shows your daily P&L with win rate per day, weekly totals, and color-coded profit/loss cells. Navigate month by month to spot patterns in your trading cadence: which weeks were profitable, where the drawdown happened, and how consistent your output really is.
- eventDaily P&L with trade count & win rate
- view_weekWeekly totals with active trading days
- savingsNet P&L, Max Drawdown & Expectancy sidebar
- navigate_nextMonth-by-month navigation
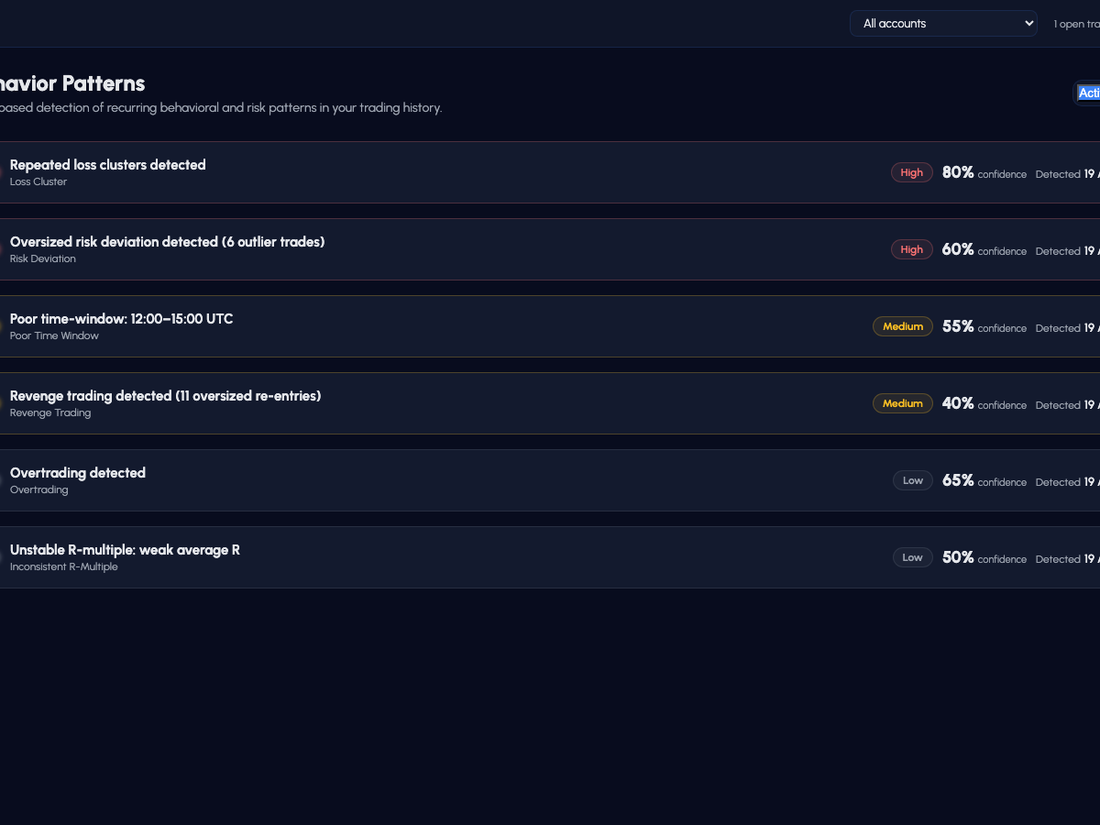
The alerts that show you where your edge is leaking.
7 automated detectors scan your full trade history and fire alerts when a behavioral or statistical pattern is detected, with severity, confidence score, explanation, and the exact trades that triggered it.
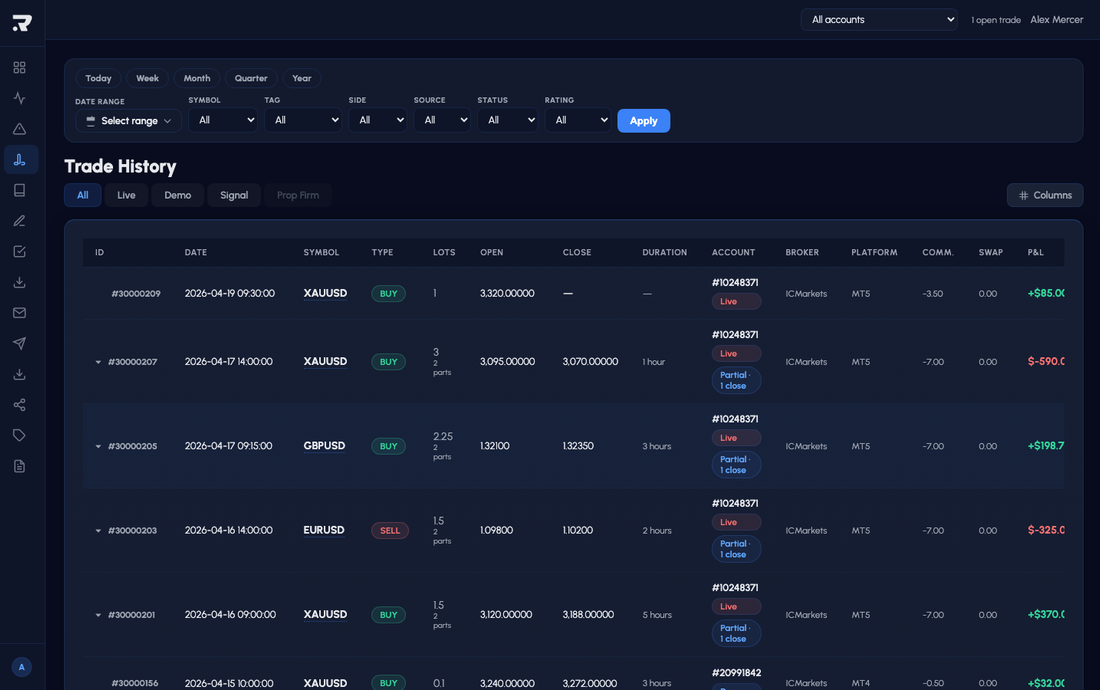
Every trade. Every detail. Every partial close.
The trade history table shows every position synced from MetaTrader, with symbol, direction, lot size, duration, P&L, commission, and swap. Partial closes are grouped under the parent trade with a full position breakdown showing each lot split.
- syncAuto-synced from MT4 & MT5 · no manual entry
- call_splitPartial closes grouped with breakdown per part
- sellStrategy tags & journal entry per trade
- account_balanceCommission & swap tracked per trade
Tag every trade. Attach your chart. Track your state.
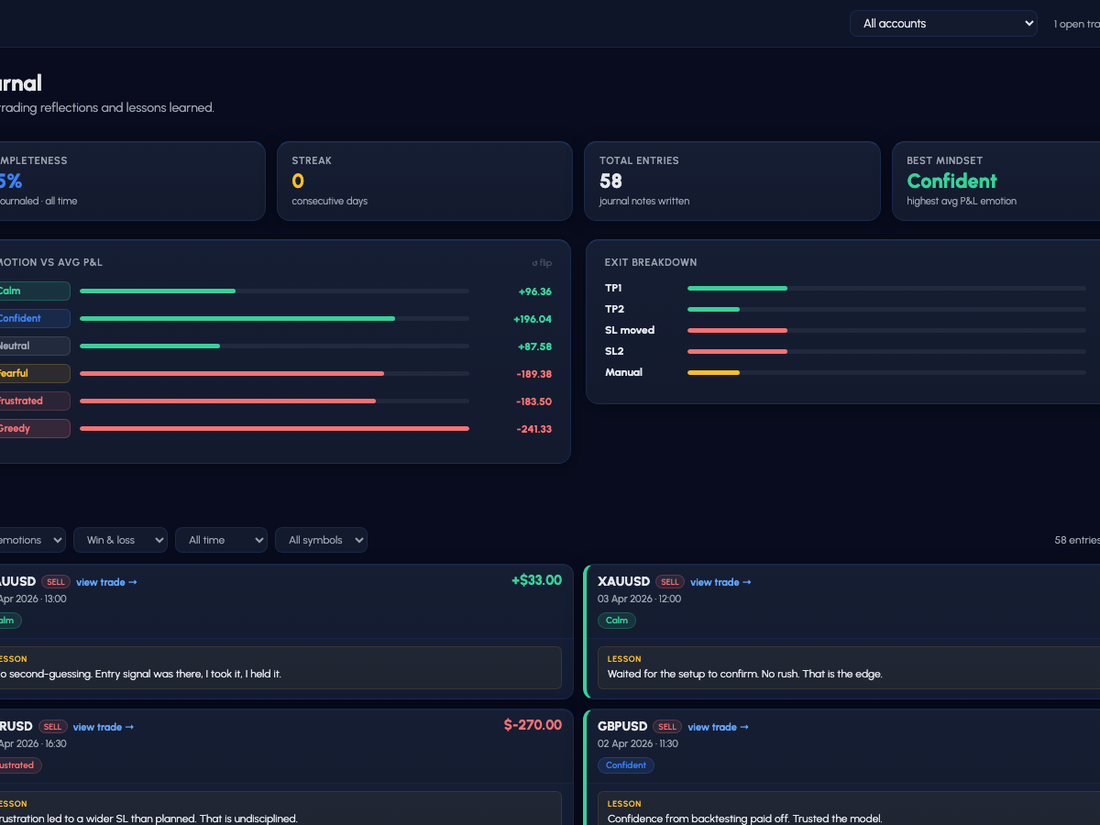
Every trade can have a journal entry, strategy tag, custom notes, screenshot of your chart markup, and a psychological state rating. Filter your trade history by strategy to see which setups actually perform.
- labelCustom strategy tags per trade
- imageChart screenshot attachments
- sentiment_satisfiedPsychological state tracking
- filter_altFilter history by strategy or tag
Find out when your edge is sharpest.
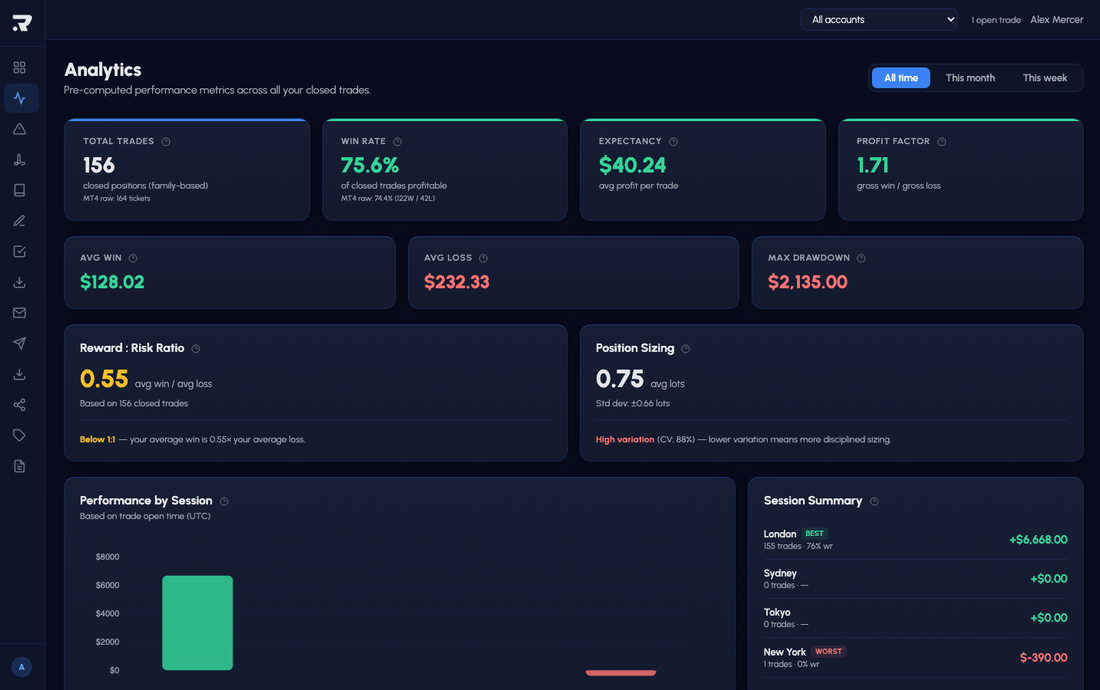
The Analytics tab breaks down your performance by session, day of the week, and hour of the day. See exactly which windows produce your best results and which ones are quietly draining your account.
- scheduleSession breakdown: London, New York, Tokyo, Sydney
- calendar_todayWin rate and expectancy per weekday
- access_timeHour-by-hour performance heatmap
- ssid_chartR-Multiple and position sizing analysis
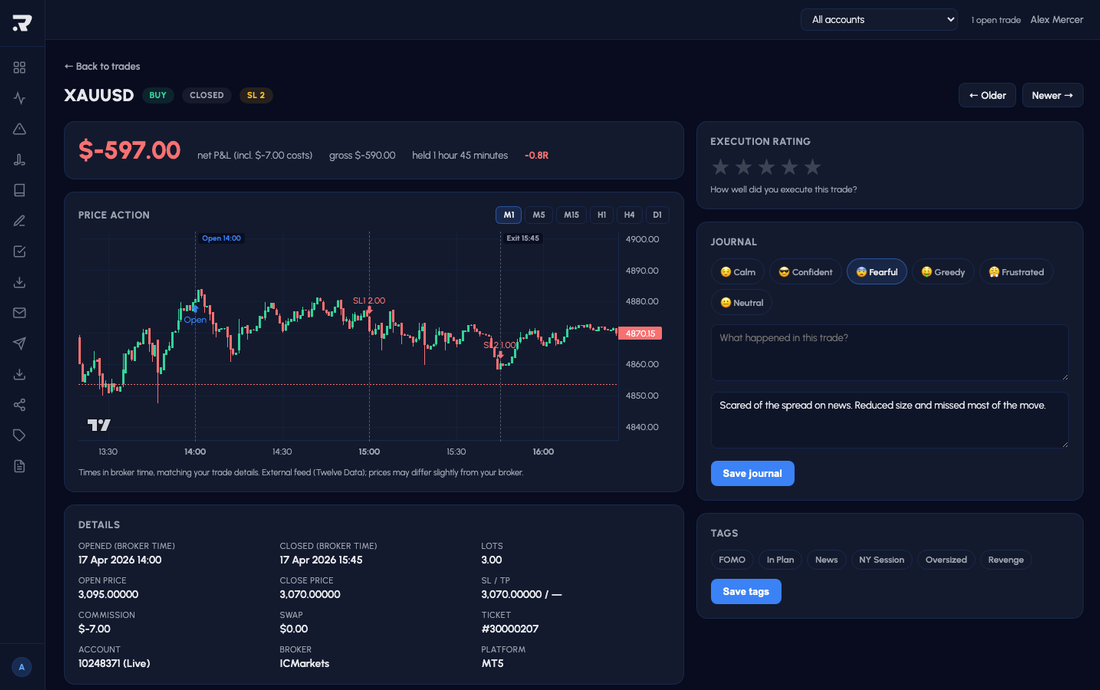
Every trade unpacked. Entry, exit, and everything between.
Open any trade to see the full breakdown: MAE and MFE lines on the OHLC chart, entry and exit markers, partial close splits, your journal note, and the Riskeys Score. A composite grade of execution quality.
- show_chartOHLC chart with MAE, MFE and entry/exit markers
- call_splitPartial close breakdown per lot split
- gradeRiskeys Score: composite execution quality grade
- notesJournal note, emotion rating and strategy tag per trade