terminalTRADING DASHBOARD
Your toolkit syncs every trade. The dashboard does the reviewing.
Every trade you execute in MetaTrader lands here automatically, so the review happens even on the days you don't feel like doing it. No CSV, no copy-paste, no forgotten week.
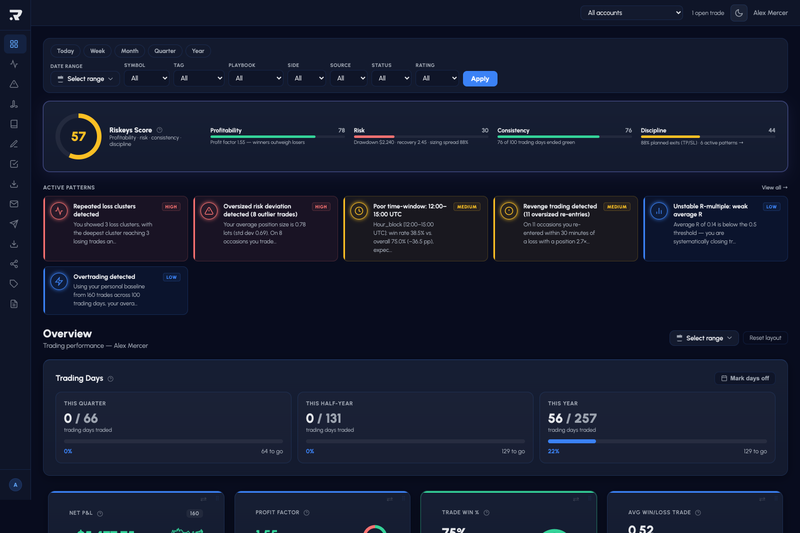
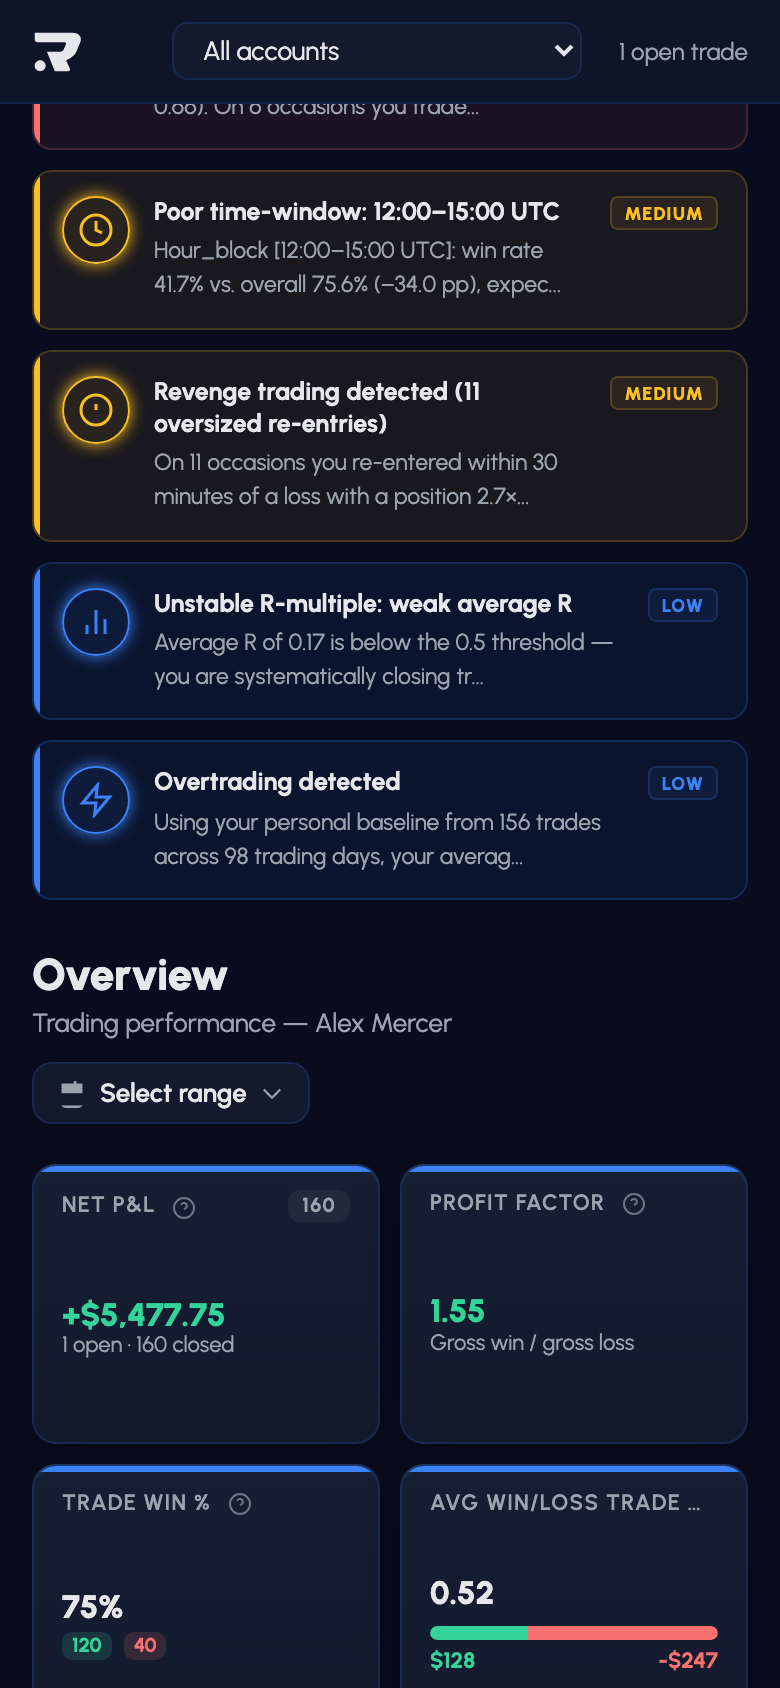
Dashboard Overview
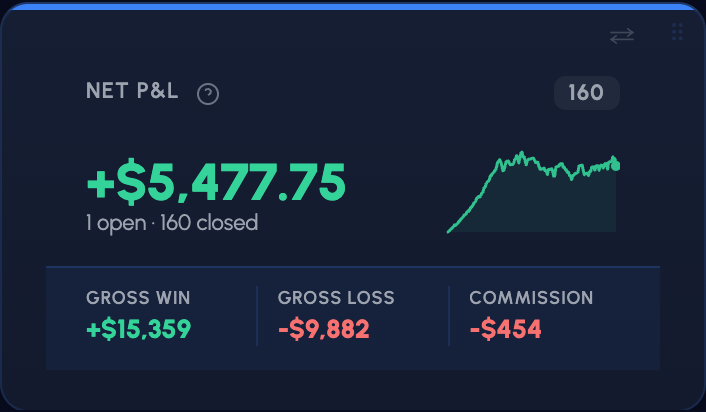
Cumulative P&L
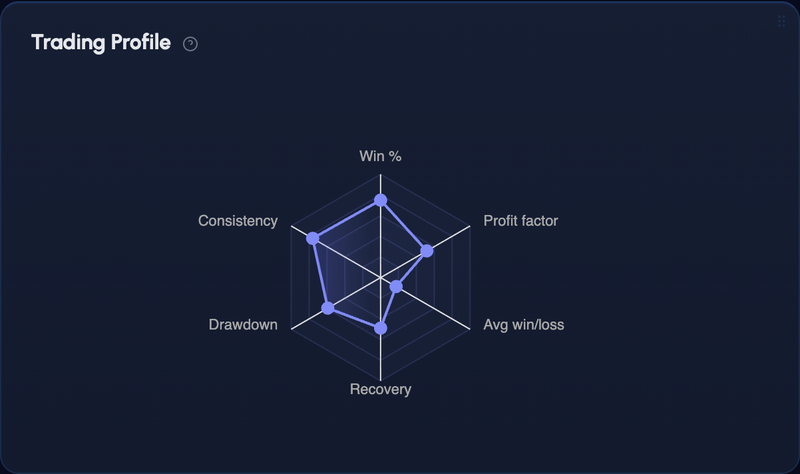
Performance Radar
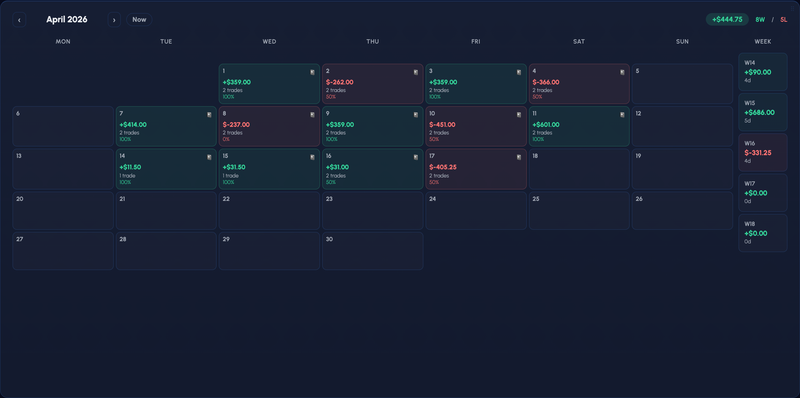
Calendar Heatmap
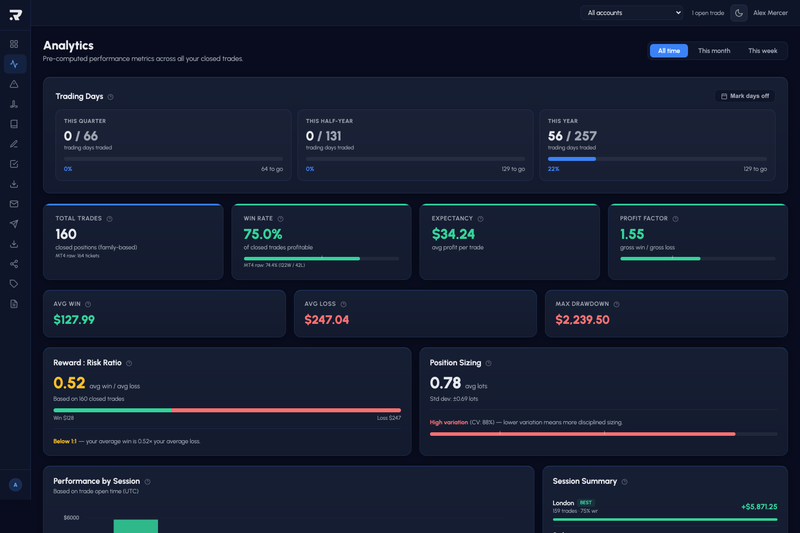
Performance Analytics
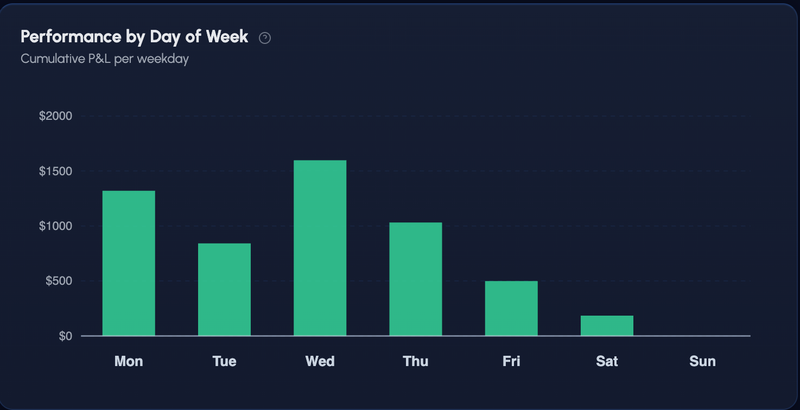
Weekday Breakdown
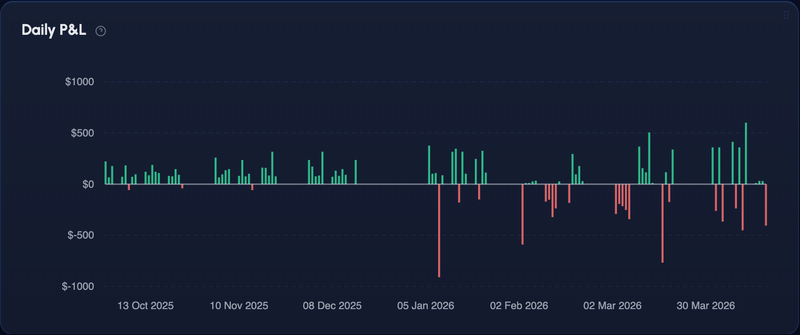
Daily P&L
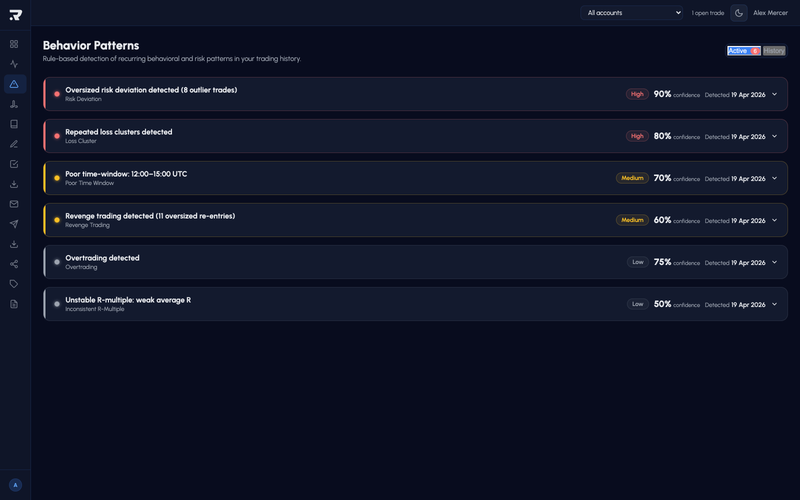
Pattern Detection
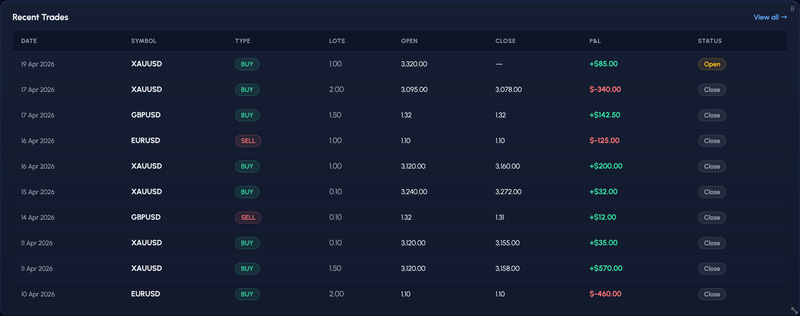
Trade History
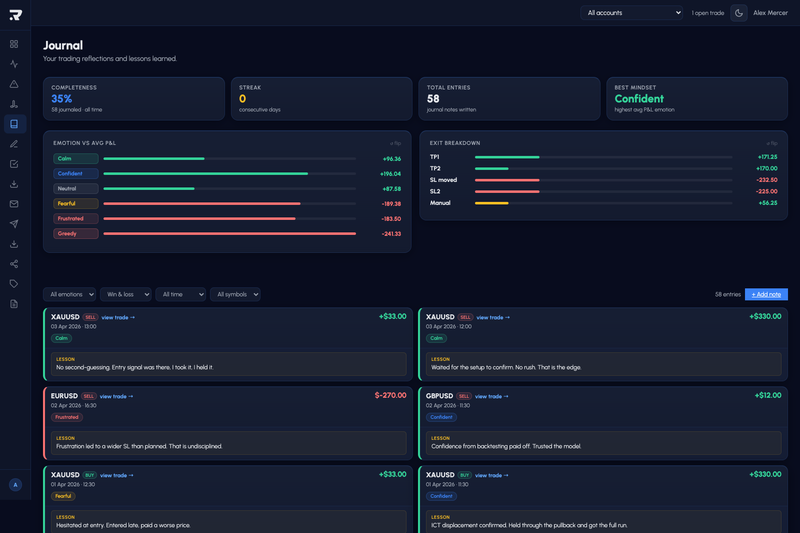
Trade Journal
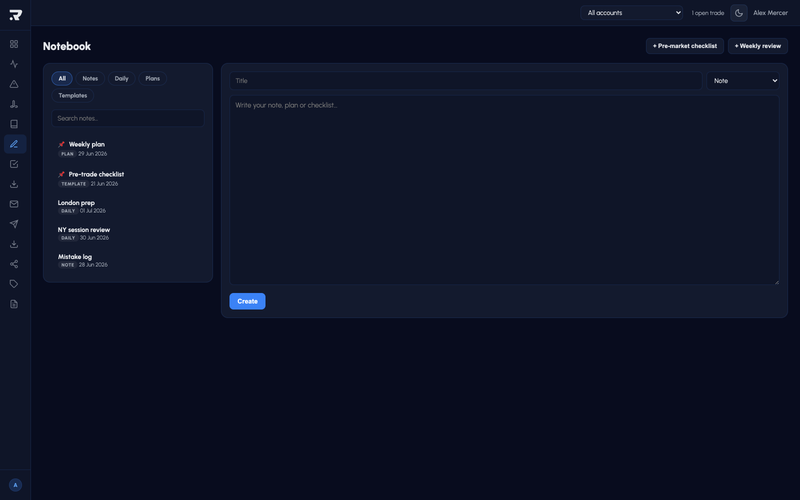
Notebook
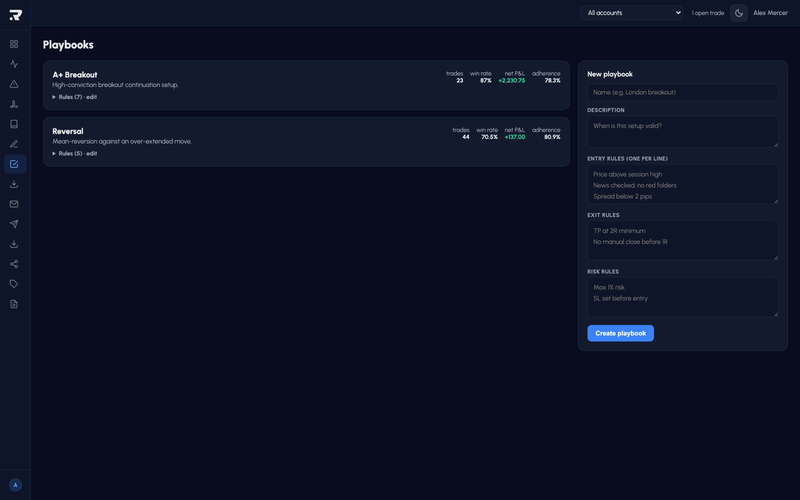
Playbooks
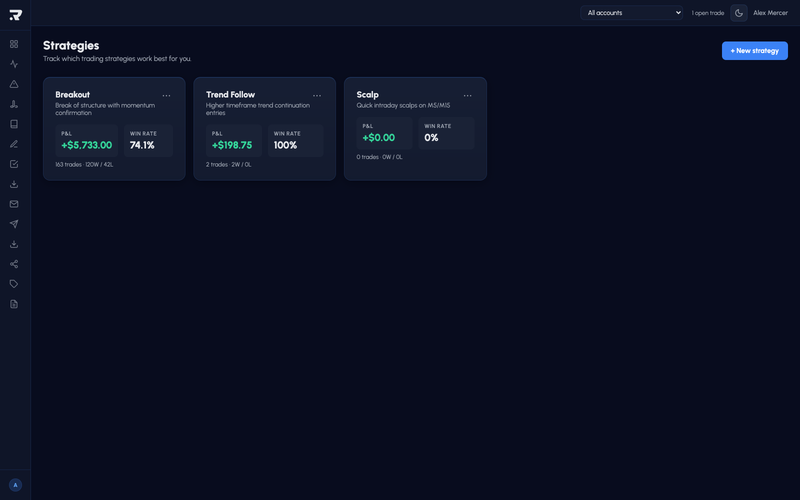
Strategies
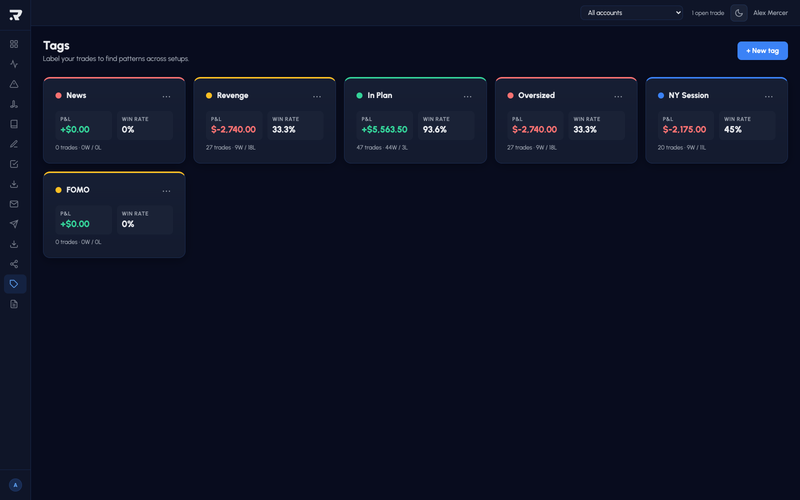
Tags
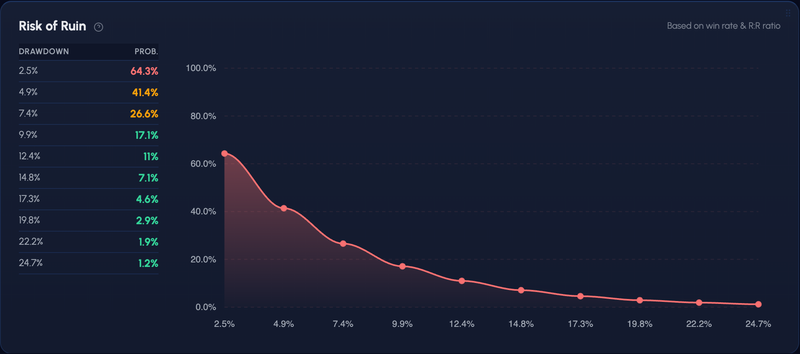
Risk of Ruin